I like being on Twitter, and I have studied their algorithms and graph structures from several angles. Here are some of the maps I have made of my Twitter circles over the years:
this is my social graph. twitter scammers come at me pic.twitter.com/d4hPa2KivM
— 🎭 (@deepfates) January 30, 2020
FINALLY
— 🎭 (@deepfates) January 6, 2021
SOCIAL GRAPH 2 pic.twitter.com/dEtWcu5EFq
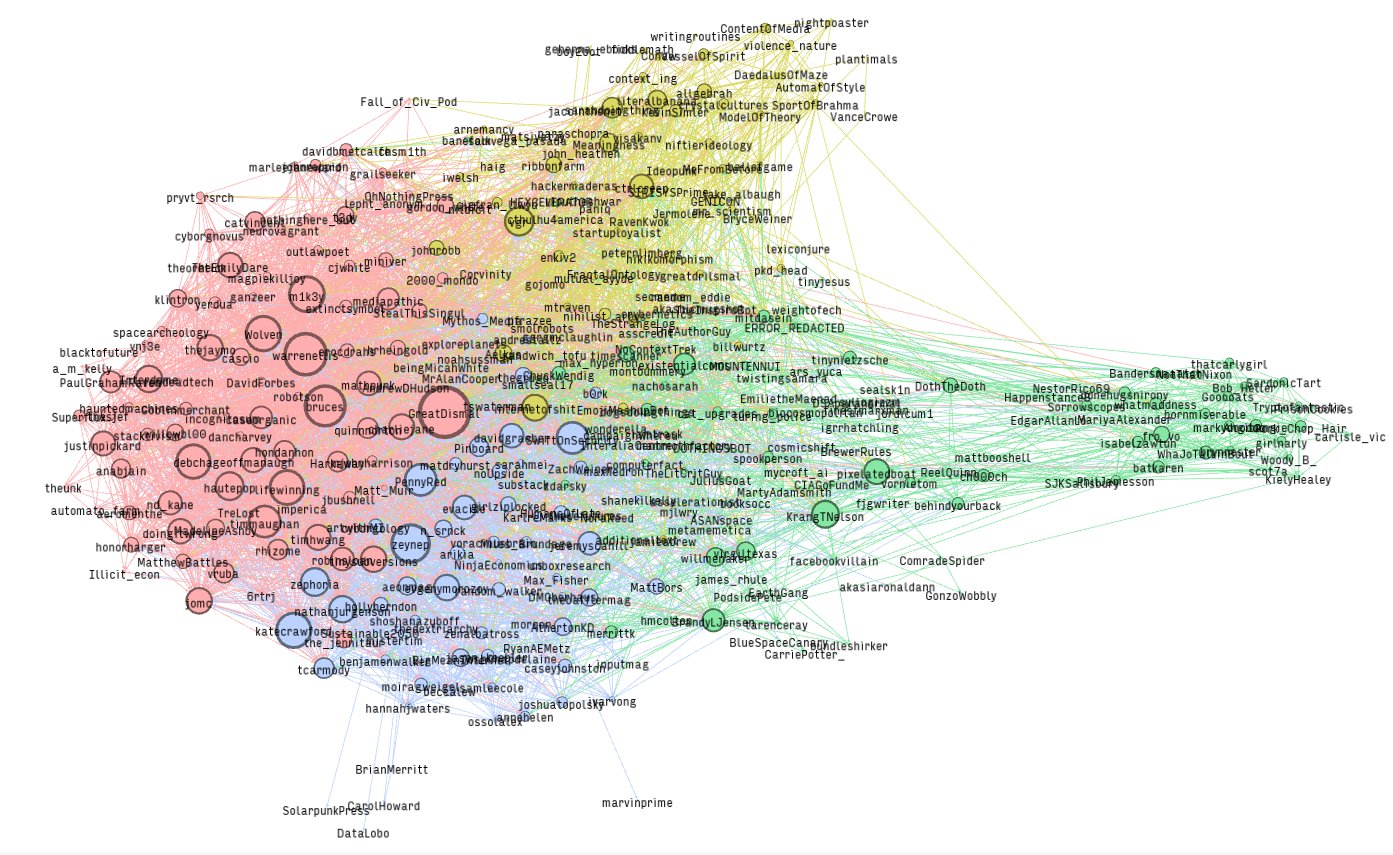
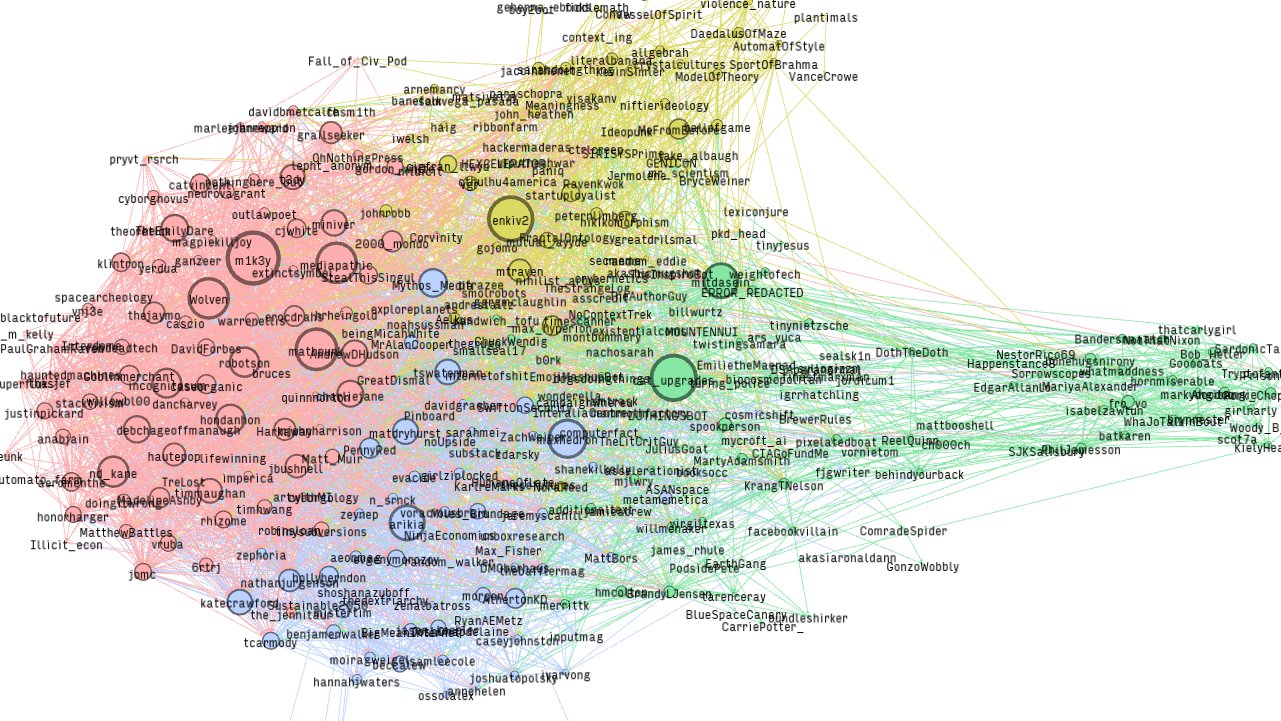
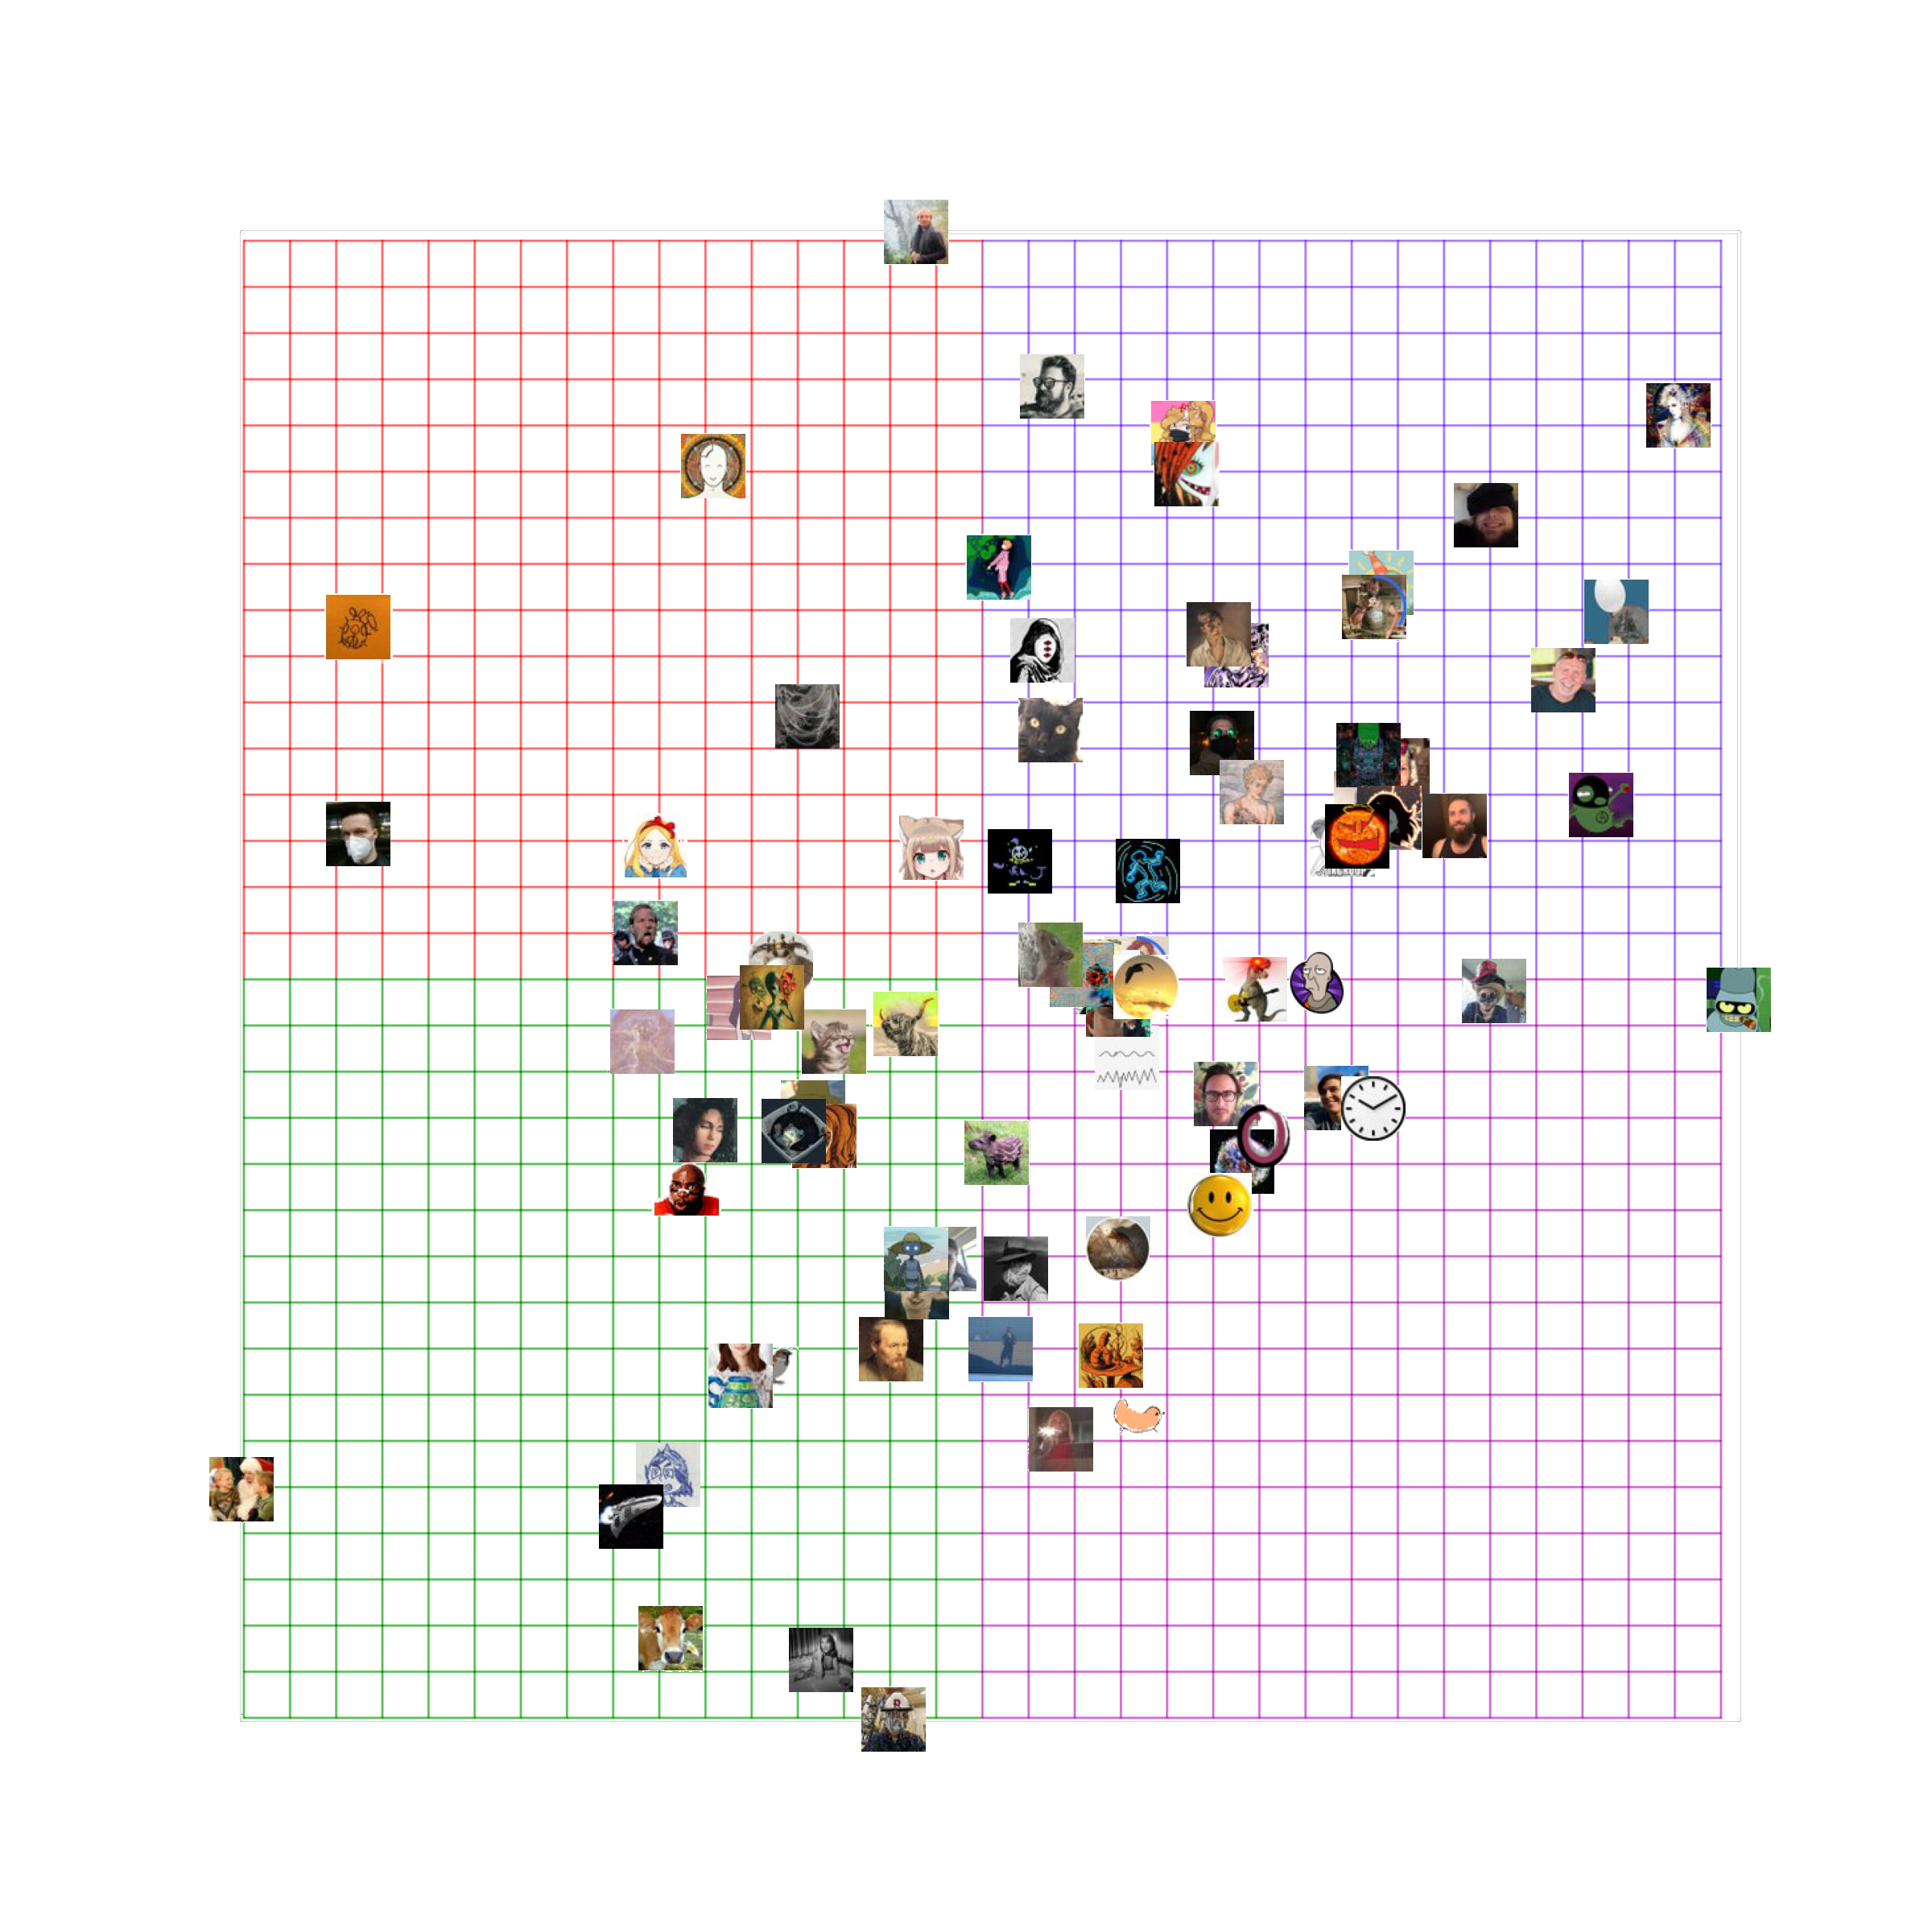
if i had to put names to the categories above
— 🎭 (@deepfates) January 6, 2021
green: normies, jokes, and people i know IRL
blue: techies and journalists (normal)
pink: futurist, techies and journalists (weird)
orange: meta-rats, digital gardeners
yellowish: post-rats, "the ingroup"
I just realized this might work as a political compass. Pink to yellow axis as generally left and right, green to blue axis as shitposter to serious poster https://t.co/lRaIhzh0Kb
— 🎭 (@deepfates) January 13, 2021
my dear friends. i have done it. 82 of you are now listed on this chart. i will reveal the axes in 100 hours (despite my campaign promise that it would be sooner) or if one of you guesses both axes
— 🎭 (@deepfates) June 11, 2021
hope it worked pic.twitter.com/AIodPLFutg
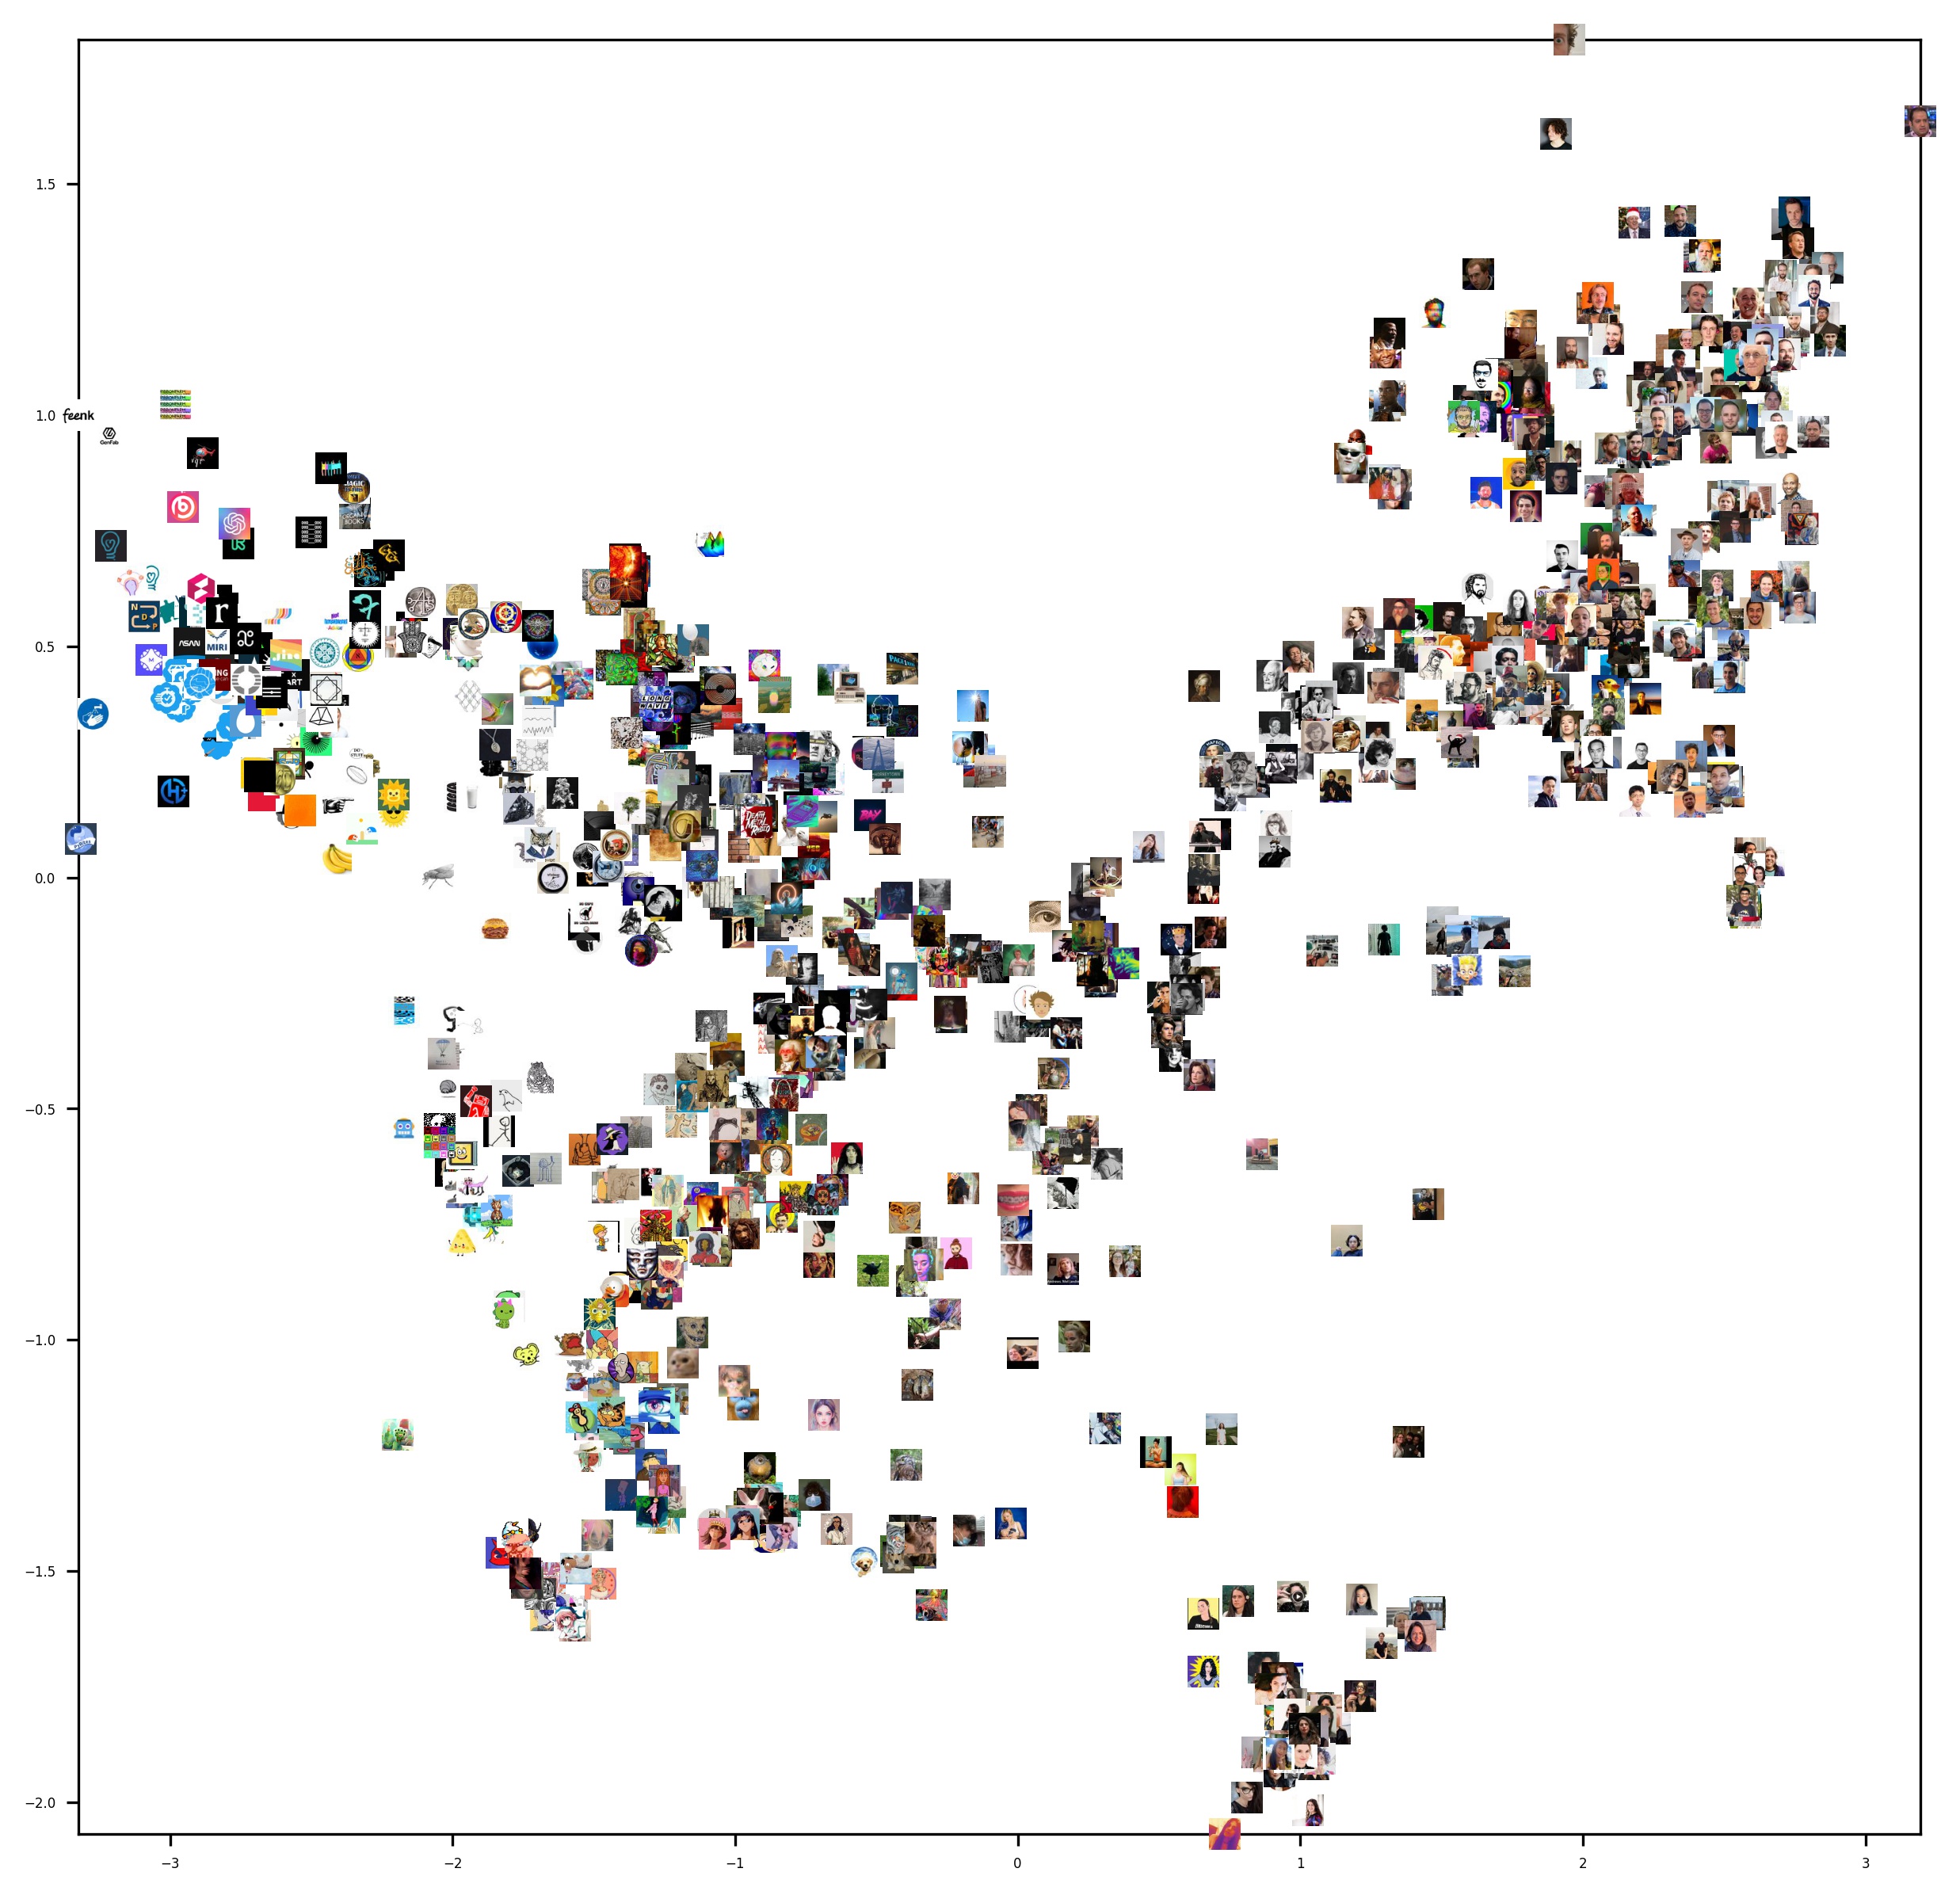
postmortem: I decided early on that I didn't want to have to personally analyze the vibe of various good users, so I would use some empirical measurement that I could simply place on a grid. and everybody has a pair of coordinates on their profile:
— 🎭 (@deepfates) June 11, 2021
Followeing Followers https://t.co/99nRqRVXd7
oh and if you were wondering, both the x and y axis are plotted on log scale. otherwise everyone would be in one tight blob in the corner with a few obvious outliers.
— 🎭 (@deepfates) June 11, 2021
the minimum and maximum of the graph are set within possible coordinates. That's why you have people on the edge
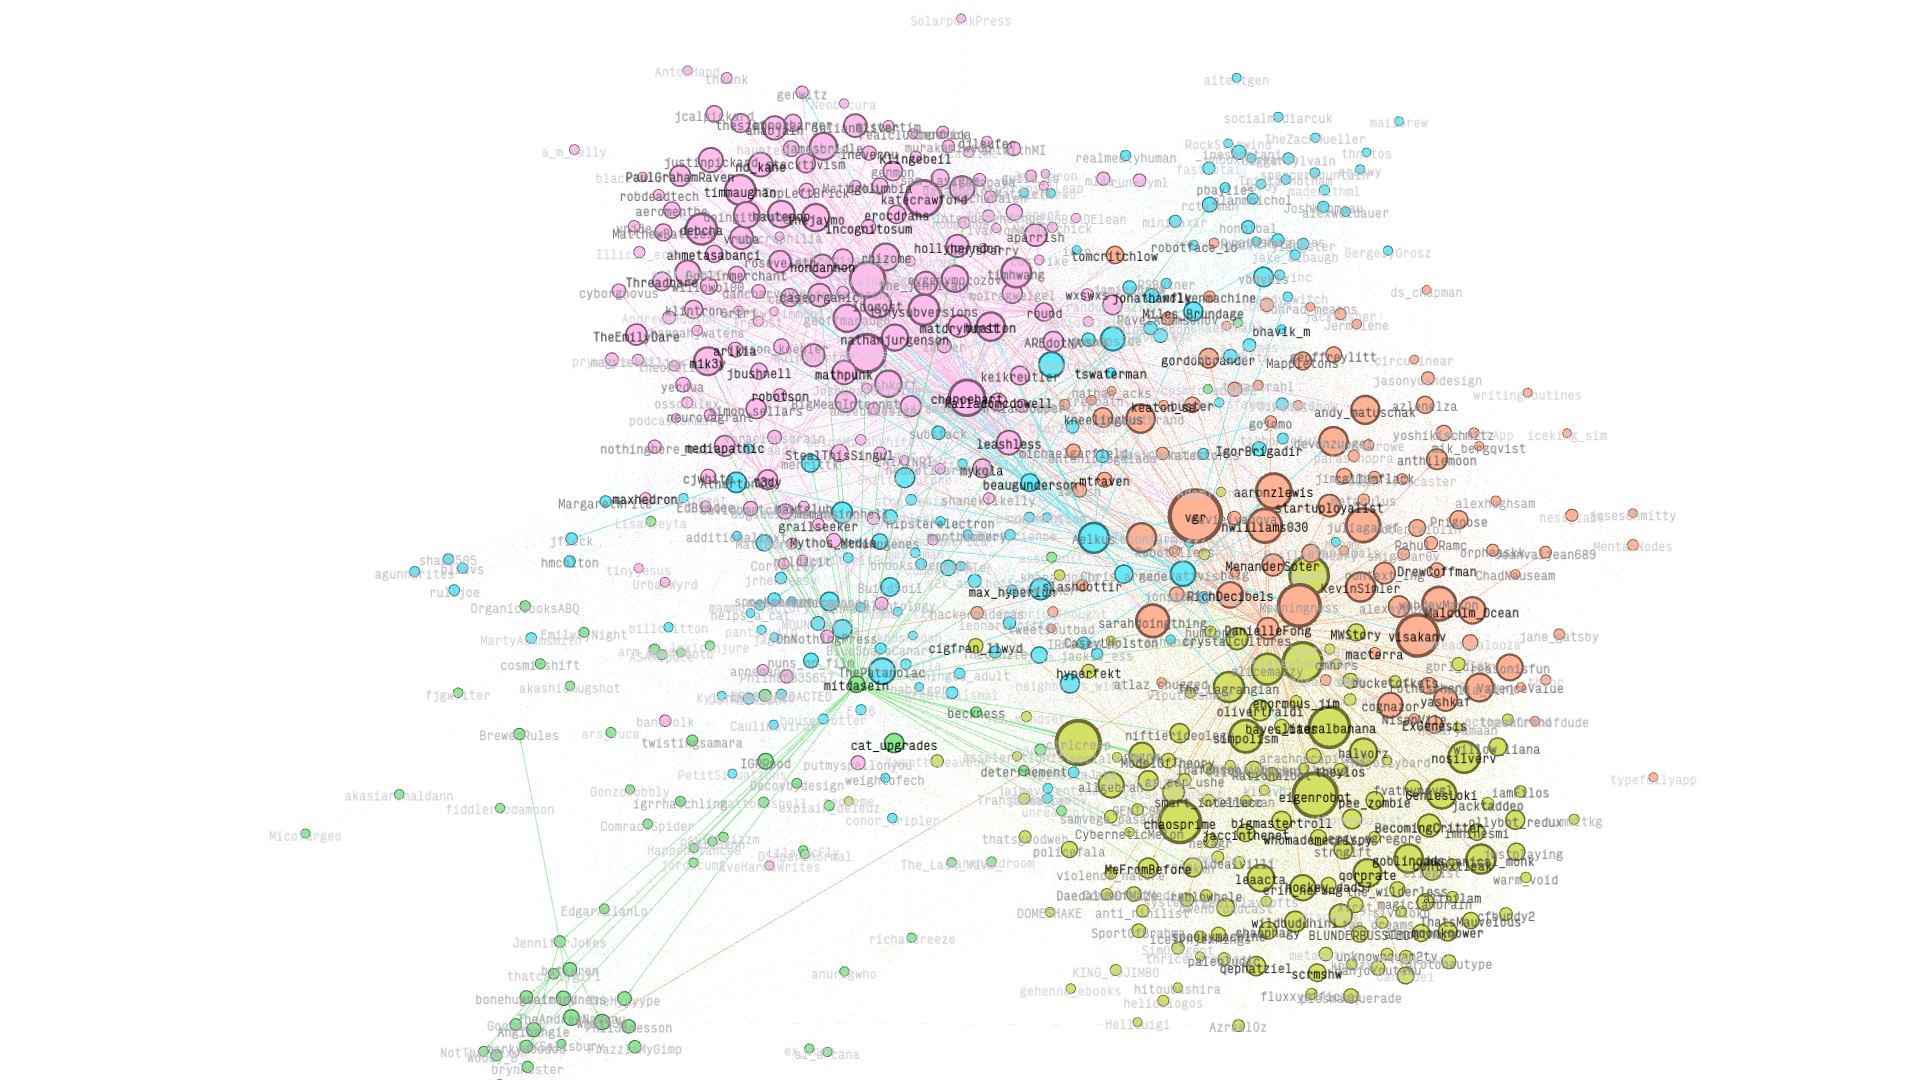
new social graph dropped. can you guess the axes?
— 🎭 (@deepfates) June 27, 2021
10K version at https://t.co/GVwoOwETzh pic.twitter.com/HzFWPPMjDL
finally
— 🎭 (@deepfates) June 27, 2021
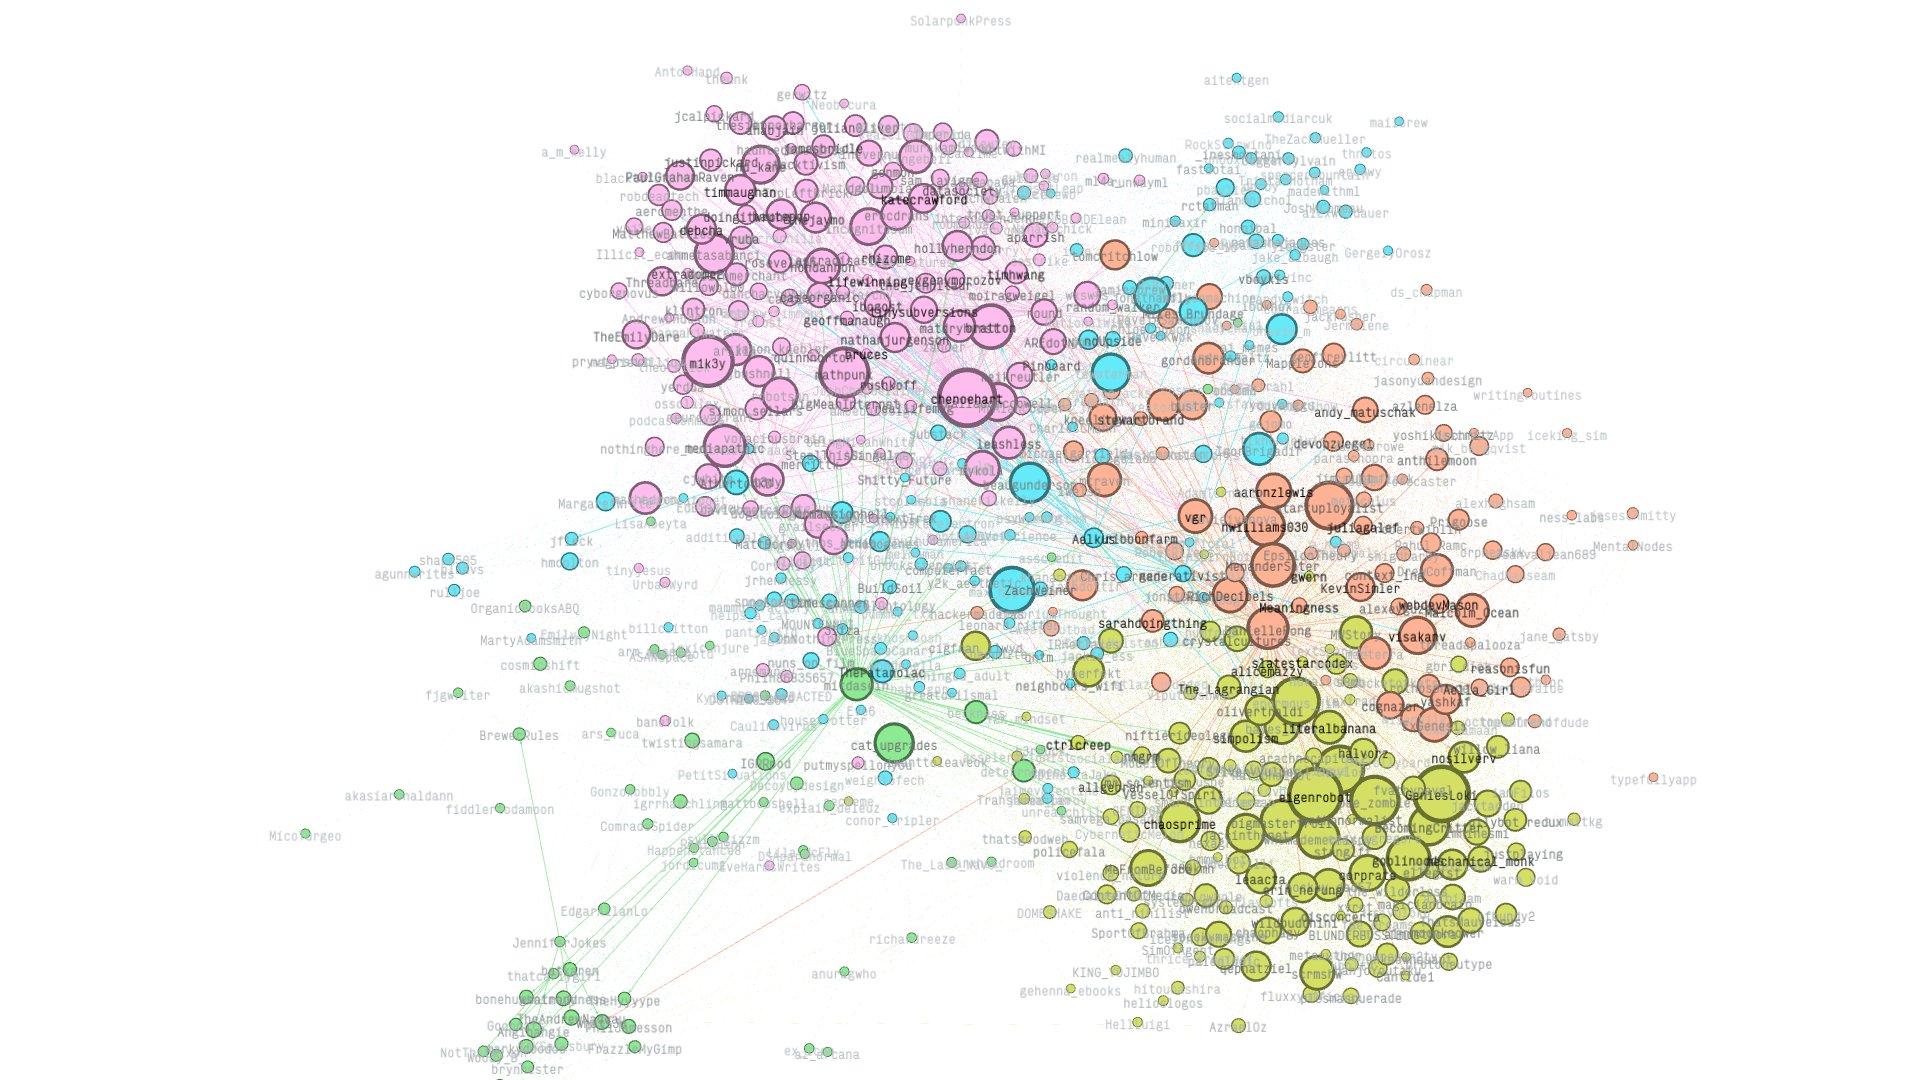
social graph 3.1 pic.twitter.com/VV96VnQ1Eo
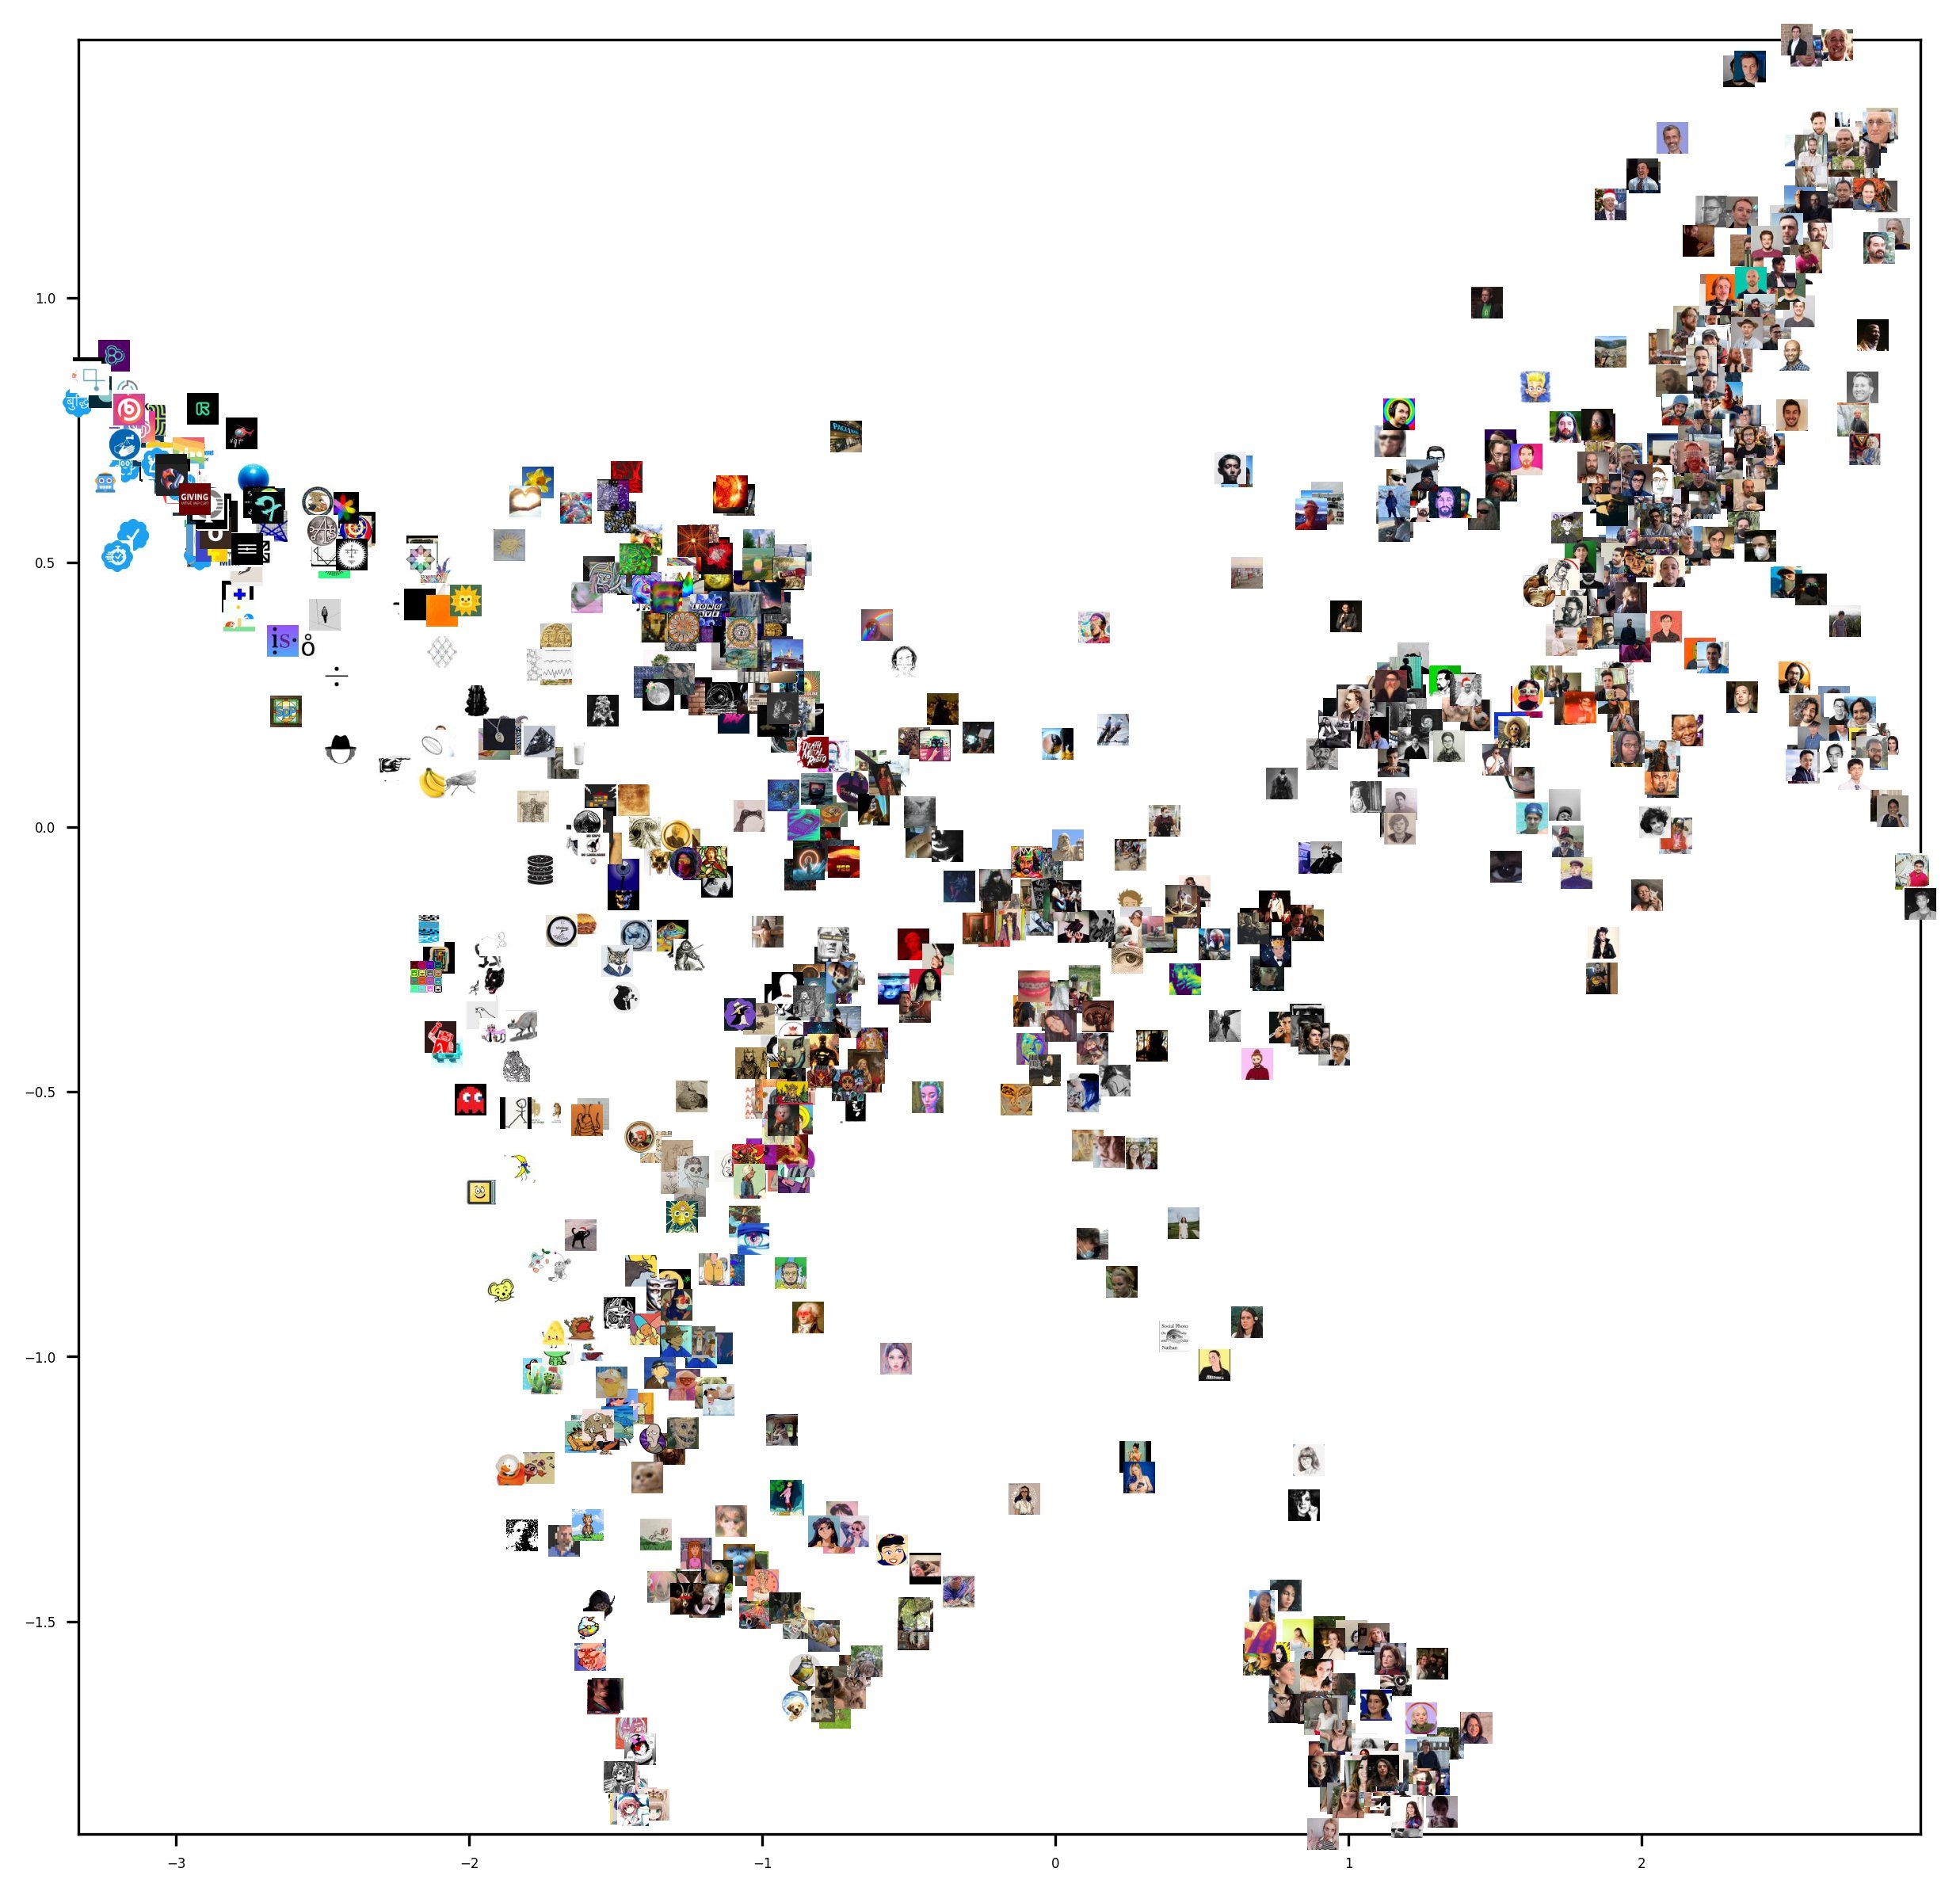
and THAT is why I need 10,000 followers. So I can create a SimCluster of my own, with my cool friends, and we can all hang out together. including you!
— 🎭 (@deepfates) July 12, 2021
pray for mehttps://t.co/v9IuF3SjgI