That’s the thing. It used to be a lot harder to tell how much to pay for a cognitive task. Now it’s a utility
Honest question, how do you measure cognitive labour?
— max guy 😐 (@GolerGkA) September 11, 2026
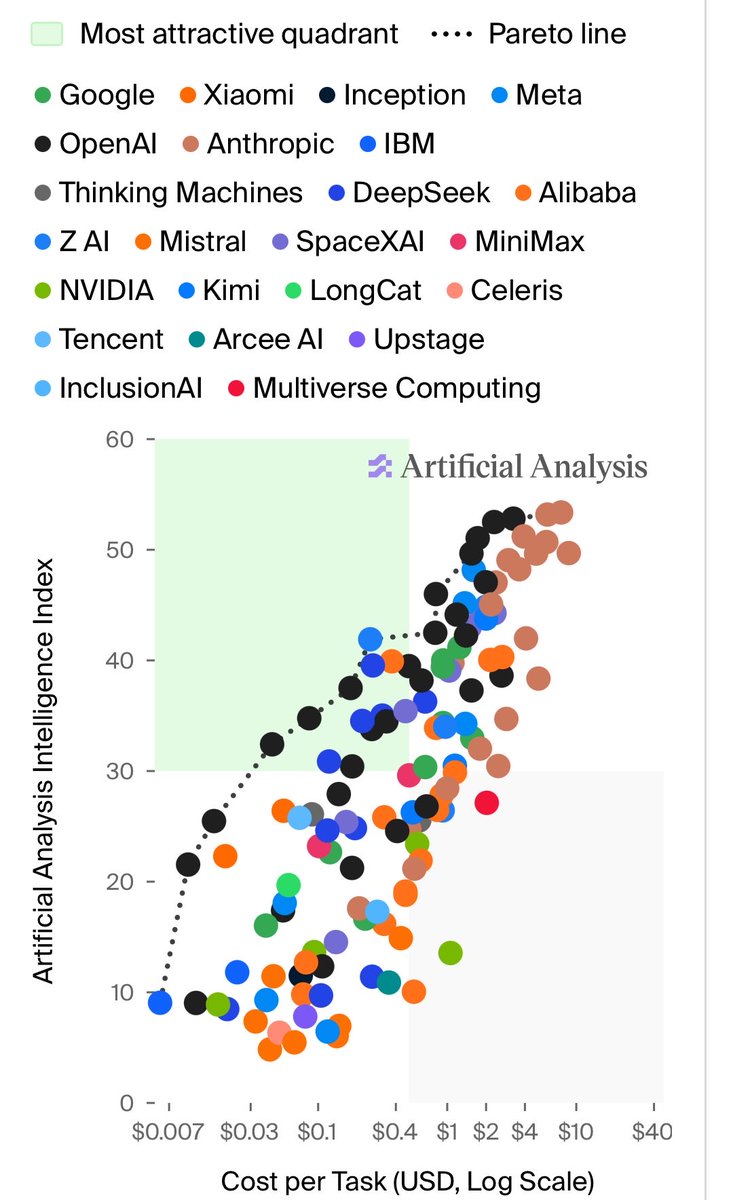
That’s the thing. It used to be a lot harder to tell how much to pay for a cognitive task. Now it’s a utility
Honest question, how do you measure cognitive labour?
— max guy 😐 (@GolerGkA) September 11, 2026