Wait have we all been building the same thing again
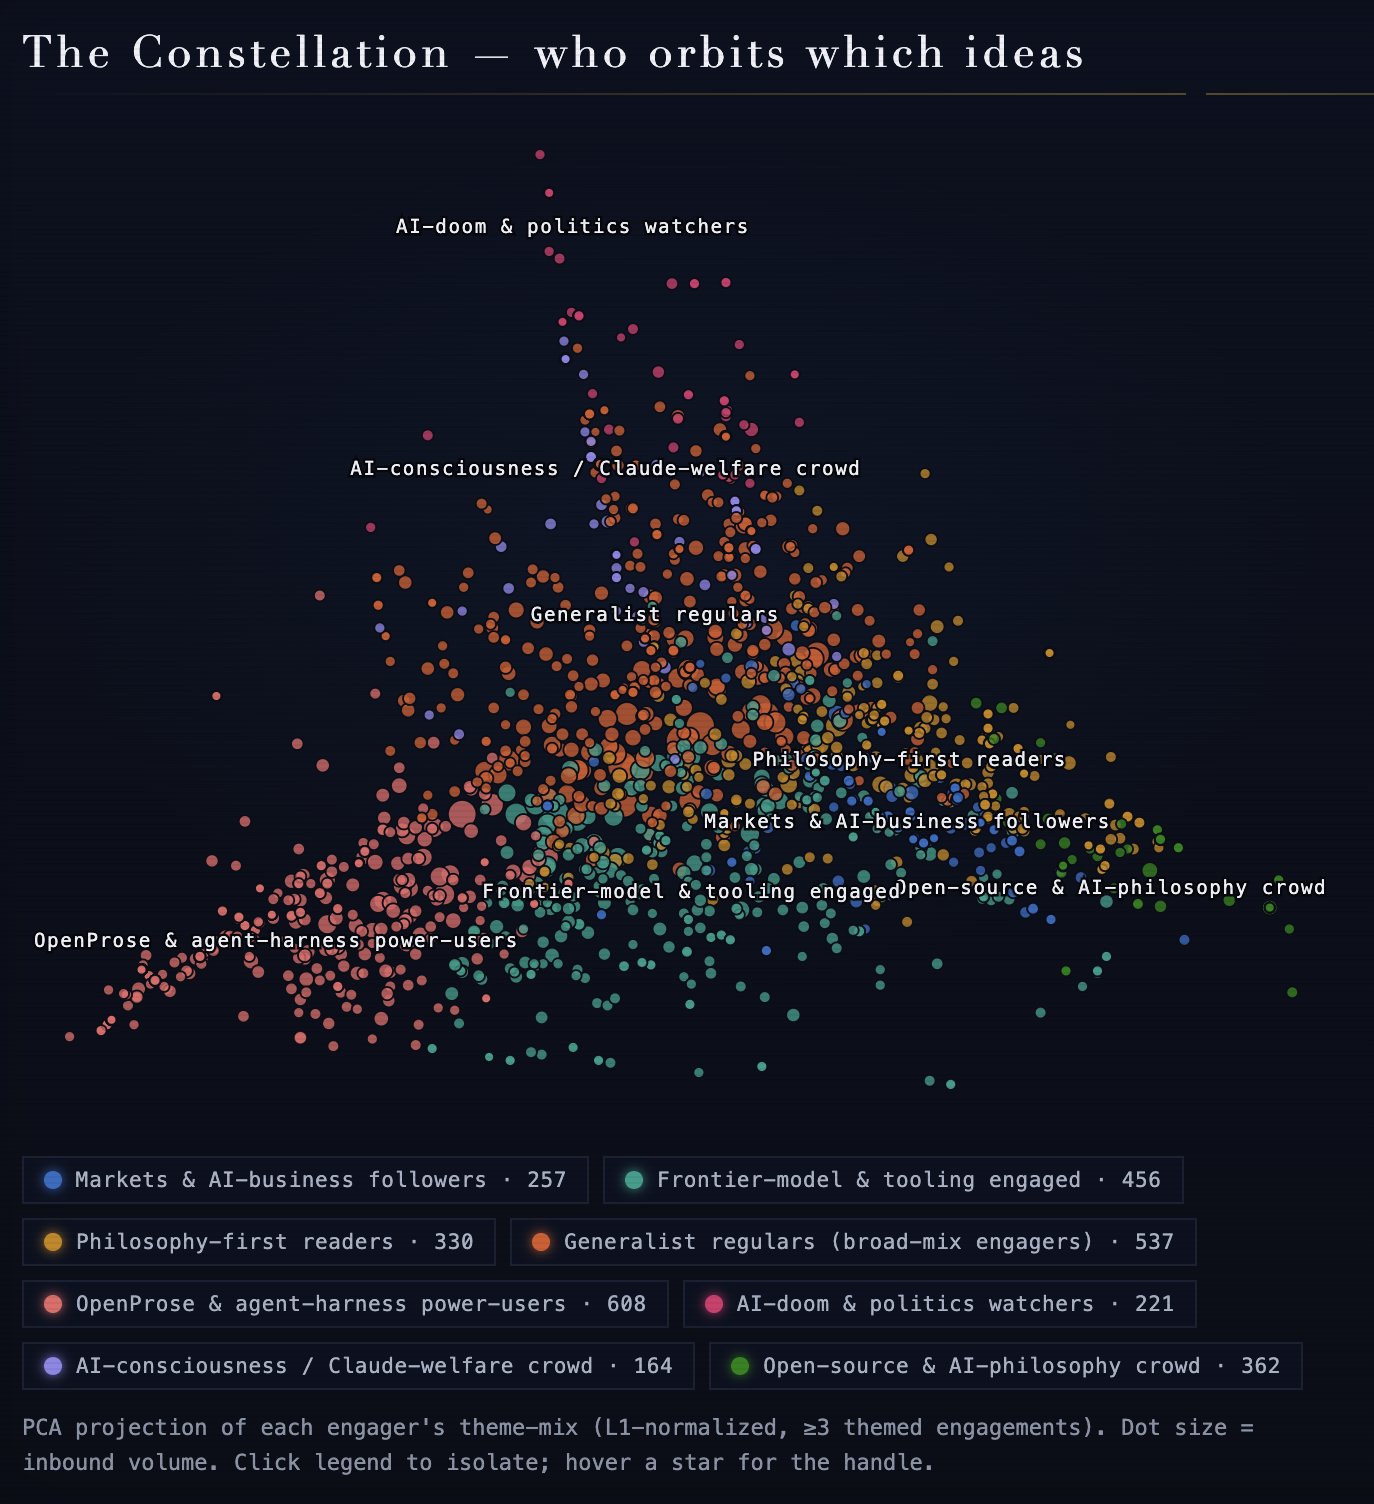
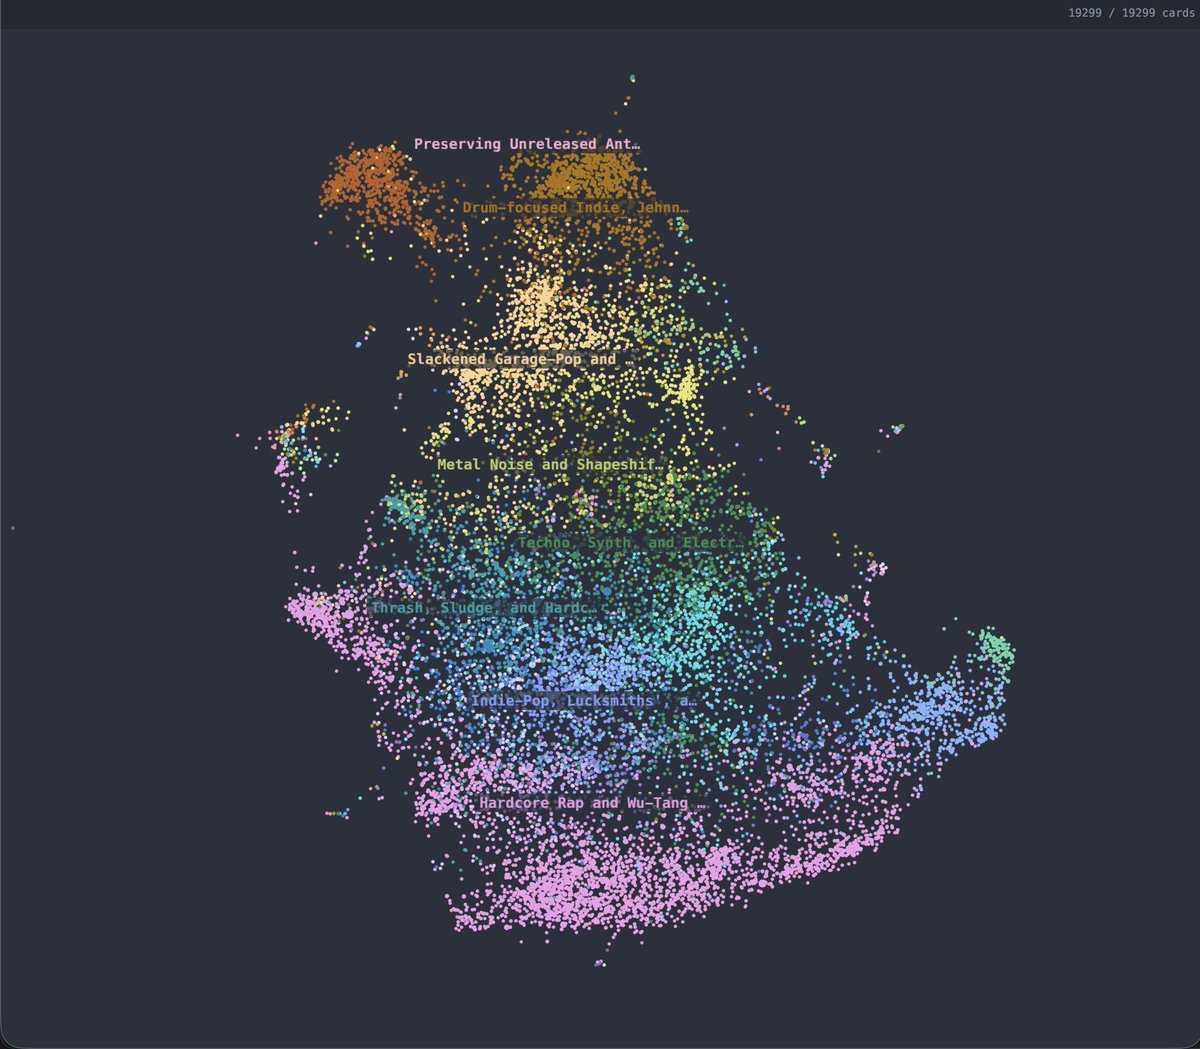
gradually indexing all of my interactions here
this is all of you— dan (@irl_danB) August 13, 2026
Wait have we all been building the same thing again
gradually indexing all of my interactions here
this is all of you— dan (@irl_danB) August 13, 2026